How to Generate a Forest Plot for Meta-Analysis?
Learn how to generate a forest plot for meta-analysis using Odds Ratios (OR) and Confidence Intervals (CI).
What is a Forest Plot?
A forest plot is a graphical representation of results from multiple studies, where each study’s effect size and confidence interval are displayed alongside a pooled estimate, allowing visual comparison across studies, according to Wikipedia’s overview of forest plots.
How to Generate a Forest Plot for Meta-Analysis?
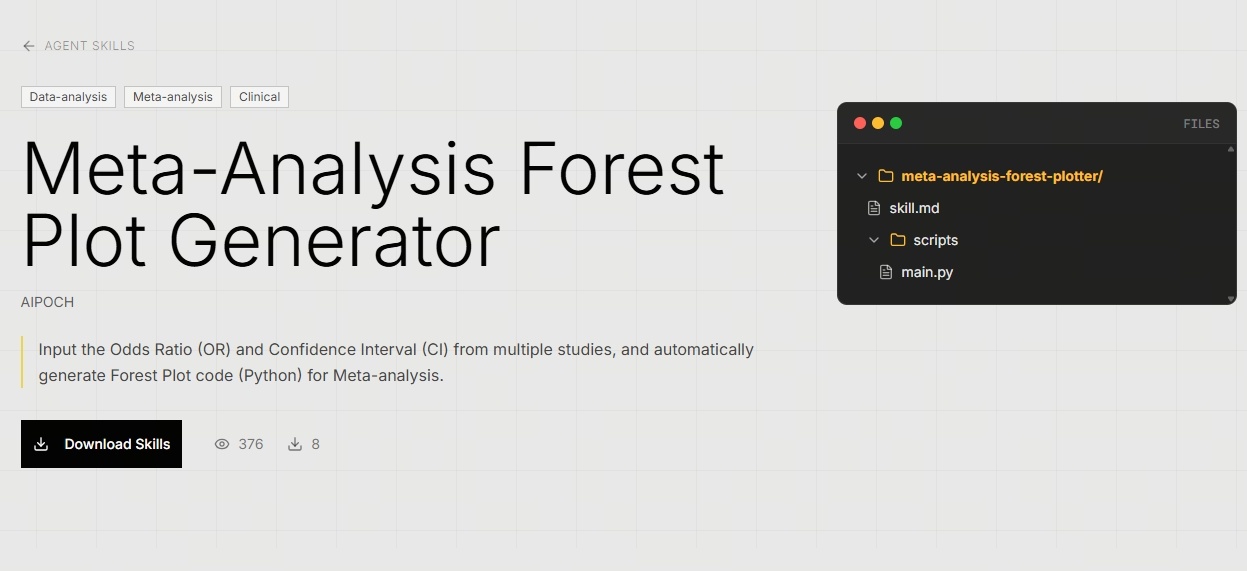
The Agent Skill"Meta-Analysis Forest Plot Generator" on AIPOCH allows users to:
-
Input Odds Ratios (OR) and Confidence Intervals (CI)
-
Automatically generate Python code for visualization
You can explore and download the agent skill here: 👉 Meta-Analysis Forest Plot Generator You can also explore more agent skills in the GitHub repository: 👉 AIPOCH Medical Research Skills
How to generate a forest plot with this AI agent skill? Meta-Analysis Forest Plot Generator
Explore more AIPOCH Agent Skills
You can explore the growing library of medical research agent skills through multiple resources:
- Open-Source Repository on GitHub
- AIPOCH Medical Research Agent Skills List – Browse all skills organized by category, from Evidence Insights to Academic Writing.
- Full Agent Skills Overview – Learn about the purpose, workflow integration, and capabilities of each skill in detail.
Disclaimer This AI-assisted content is provided for informational purposes only and does not constitute medical or professional advice.Agent skills like the Meta-Analysis Forest Plot Generator on AIPOCH are designed to assist with visualization, but users should verify their data and ensure appropriate analysis methods are used. Users are responsible for verifying the accuracy of the information and for any decisions made based on it.