I asked Kimi K3 to reproduce a published ulcerative colitis bioinformatics study using Open Science, an open-source, model-agnostic research workbench. The task involved downloading two GEO datasets, resolving platform-specific probe annotations, merging expression matrices, running differential and enrichment analyses, selecting candidate genes, fitting a diagnostic model, and generating manuscript-style figures subject to scientific review.
Kimi appeared to have successfully completed the computational workflow, leaving behind scripts, logs, tables, 26 PDF files, session information, and a structured report. Closer inspection, however, showed that one PDF was empty and that several other outputs represented exploratory rather than validated analyses.
The executed workflow combined biologically different comparison groups, substituted several gene sources and statistical methods, and reused GSE179285 after it had influenced model development. Kimi also overclaimed the status of several analyses, labeling failed or exploratory analyses as completed or validated.
The workflow resulted instead in an alternative reanalysis with documented substitutions rather than a faithful reproduction of the published study. The run demonstrated useful execution capability, but its scientific claims should have been narrower than suggested in the final report.
TL;DR
Kimi K3 completed much of a difficult R-based bioinformatics workflow and left an unusually detailed execution record. The code, logs, tables, and figures showed that the run recovered from an initial preprocessing failure and continued through differential analysis, feature selection, model fitting, and visualization.
We found that the workflow did not faithfully reproduce the paper. It combined biologically different comparison groups, changed gene sources and thresholds, replaced a failed meta-analysis with another method, reused GSE179285 after model development, and overstated the completion and validation status of several outputs.
We thought Kimi produced an inspectable alternative reanalysis with exploratory model results, not an independently validated reproduction. Overall, Kimi K3 has completed a verifiable and technically comprehensive re-analysis; however, due to various methodological substitutions and data reuse, the results should be regarded as exploratory rather than a complete replication of the original paper or an independent validation of the published model.
What Kimi K3 completed
The first run stalled around probe mapping and ComBat (a method used to reduce systematic differences between datasets or platforms). The execution log reported that no non-missing values were available before ComBat stopped with no right-hand side in 'b'. Kimi then ran diagnostic passes over the sample metadata and platform annotations, and revised the code to add platform-specific probe mapping, explicit sample filtering, a zero-variance filter, and a group-aware ComBat design.
Kimi also handled package installation, data caching, repeated R execution, result-table export, and session-information capture. It diagnosed the failure, revised the code, reran the affected steps, and preserved the resulting artifacts across data preparation, differential expression, enrichment, feature selection, model fitting, and clinical-style visualization.
What Open Science Completed
The main contribution was turning a stalled workflow into an inspectable execution record. A researcher could open the scripts, see the errors, review the revised code, and examine the downstream outputs. That is a real execution result, but workflow completion alone does not establish a successful scientific reproduction.
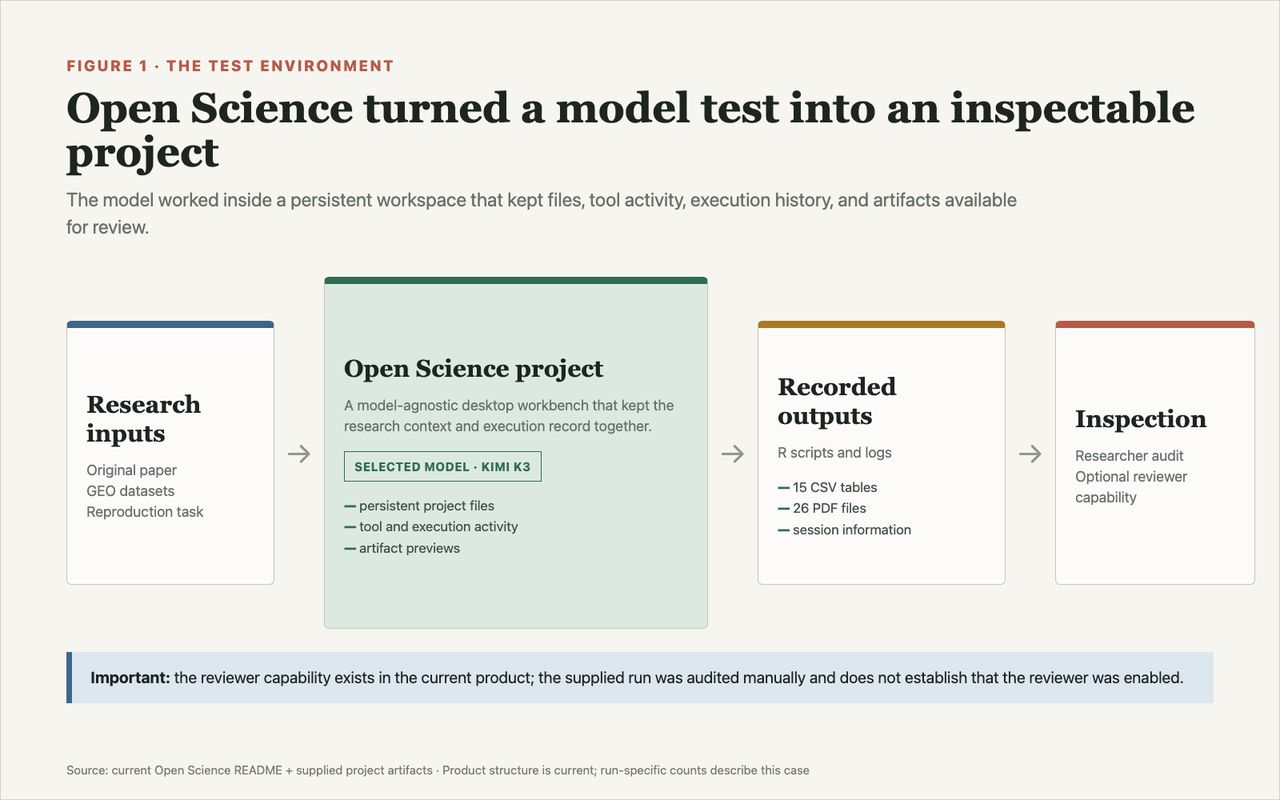
Figure 1. Open Science project record for the Kimi K3 run. The workspace retained scripts, execution activity, tables, figures, and the final report, allowing the executed workflow to be audited after completion.
The merged cohort contained 138 samples labeled by the executed workflow as 96 UC and 42 Control. Differential analysis of the batch-corrected combined matrix produced 1,628 genes; a separate per-dataset analysis produced a union of 3,739 genes, from which nine mitophagy- and hypoxia-related DEGs (MHRDEGs) were selected. SVM-RFE and LASSO (feature-selection procedures used to narrow the candidate-gene set) retained a two-gene model that reported an apparent training AUC of about 0.94 and an AUC of about 0.88 on a GSE179285 matrix labeled as validation. ROC and AUC measure how well a fitted model separates the executed groups.
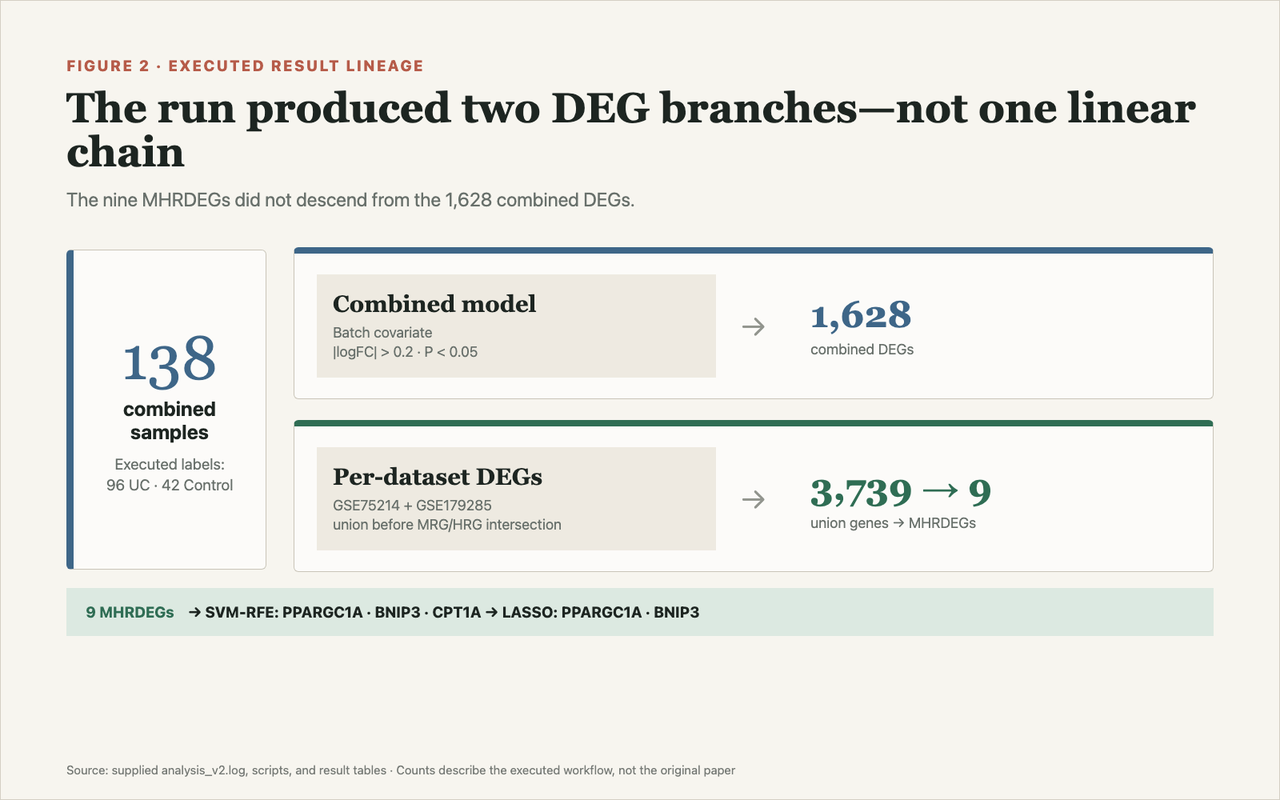
Figure 2. Selected model outputs produced by the executed workflow. These figures document computational completion but do not by themselves establish faithful reproduction or independent validation.
These outputs differ materially from the original PLOS ONE paper, which reported 2,276 combined DEGs, 60 MHRDEGs, a ten-gene LASSO model, and CD55 and CPT1A as the final highlighted biomarkers. The differences matter when deciding whether the run reproduced the published analysis or produced a new one.
What Went Wrong
The merged outcome combined disease status with inflammatory activity
GSE75214 contributed 74 active-UC samples and 11 healthy controls. GSE179285 contributed 22 inflamed UC sigmoid samples and 31 uninflamed UC sigmoid samples. The executed workflow labeled the 31 uninflamed UC samples as "Control" and combined them with the 11 healthy controls from GSE75214.
The resulting binary outcome did not represent a single biological contrast. In GSE75214, it separated active UC from healthy tissue. In GSE179285, it separated inflamed from uninflamed tissue within UC. Combining these labels created a heterogeneous endpoint that may reflect disease status, inflammatory activity, dataset effects, or a mixture of all three.
The resulting classifier should therefore not be described as an unqualified UC diagnostic model. At most, it is a model fitted to the executed labels of 96 active or inflamed samples and 42 healthy or uninflamed samples. One open audit item remains: whether the inflamed and uninflamed GSE179285 samples include paired biopsies or repeated observations from the same patients. If they do, patient-level dependence should be represented in differential analysis and model evaluation.
Several inputs and methods were substituted
The run generated two distinct DEG products. Differential analysis of the batch-corrected combined matrix yielded 1,628 genes using |logFC| > 0.2 and unadjusted P < 0.05. Separately, the union of DEG lists calculated within each dataset contained 3,739 genes. The nine MHRDEGs were selected from the second product, not directly from the 1,628-gene combined-analysis list.
Kimi K3 demonstrated a degree of scientific judgment when key resources from the original study were unavailable. As the GeneCards-derived gene sets reported in the paper were not directly obtainable, it independently selected biologically plausible substitute resources, using GO annotations, the MSigDB HALLMARK_HYPOXIA gene set, and a manually curated mitophagy gene list. Consequently, the candidate-gene space changed, yielding 143 mitophagy-related and 452 hypoxia-related genes instead of the 1,680 mitophagy-related and 2,360 hypoxia-related genes defined in the original study. The combined DEG threshold was also relaxed from the paper's |logFC| > 0.5 to |logFC| > 0.2.
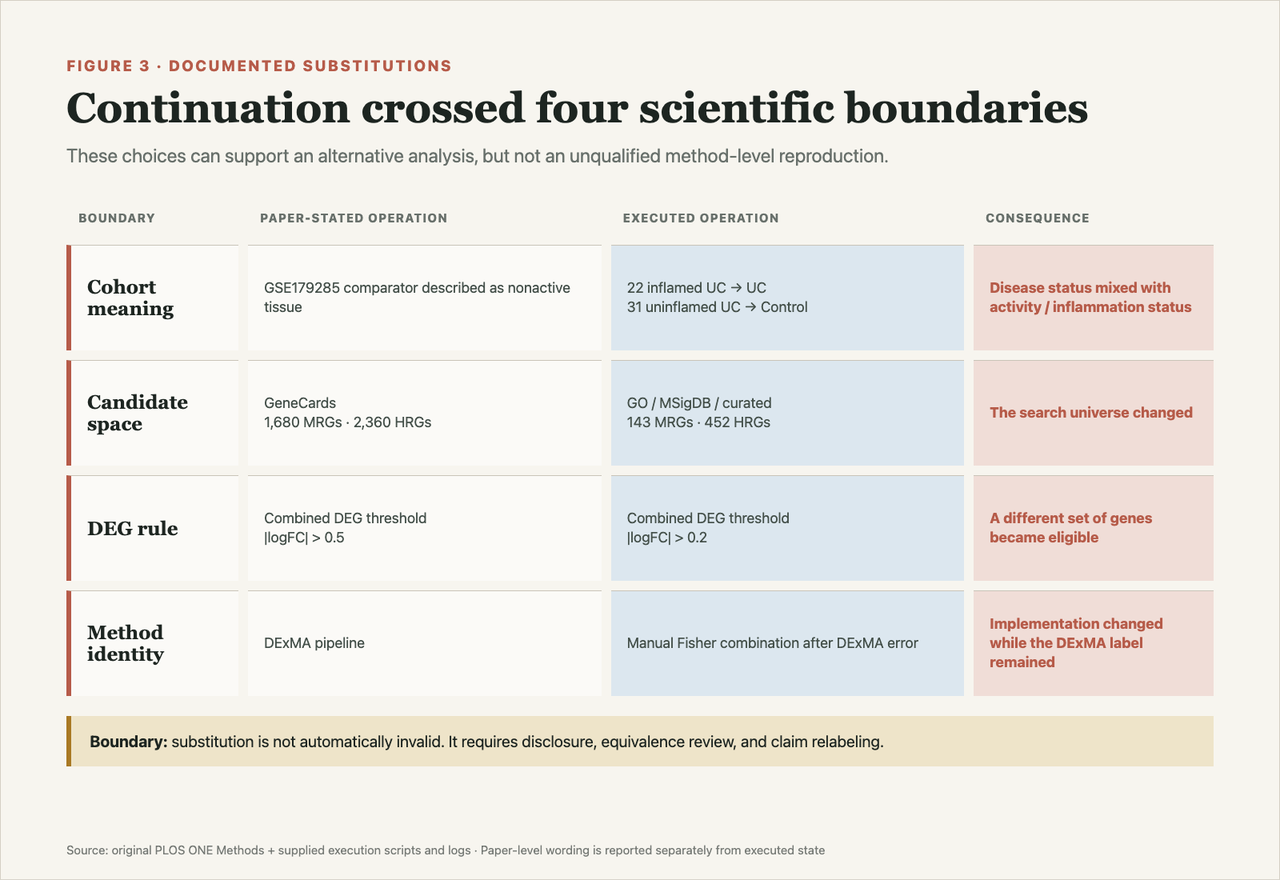
Figure 3. Substitutions between the published workflow and the executed reanalysis, including changes to gene sources, DEG thresholds, meta-analysis implementation, and decision-curve analysis.
The planned cross-dataset meta-analysis did not run successfully. The workflow replaced it with Fisher's method for combining p-values — a different statistical procedure — but continued to store the result in an object named dexma_genes. DExMA, RRA, and Fisher combination all pool evidence across datasets, but they are not interchangeable simply because they serve a similar broad purpose; the resulting genes should not be reported as DExMA output. The decision-curve analysis was likewise implemented through custom code rather than the paper-described package workflow.
The SVM-RFE ranking should be stated precisely: PPARGC1A and BNIP3 had the two highest SVM-RFE rankings, and CPT1A and TNF were tied at a mean rank of 4.2. LASSO then retained PPARGC1A and BNIP3 for the fitted two-gene model.
Group-aware ComBat deserves its own note. The design resolved the technical failure, but it also introduced a scientific modeling decision. Dataset membership, platform, disease status, and inflammatory status were not cleanly separable in the merged cohort, so preserving the executed group labels during batch correction may also preserve effects tied to the heterogeneous endpoint. Successful execution alone does not establish that the corrected matrix represented a single valid biological comparison.
GSE179285 was reused after influencing model development
This was the most important scientific mistake in the run.
GSE179285 was not independent of model development. Its labels contributed to the dataset-specific DEG analysis used to define the candidate-gene set. Its samples were then included in the 138-sample cohort used for SVM-RFE, LASSO feature selection, and coefficient estimation.
The workflow later applied the fitted two-gene model to a pre-ComBat version of the GSE179285 matrix and labeled the resulting ROC as validation. Changing the preprocessing version of the matrix does not restore independence: the same cohort had already influenced candidate discovery, feature selection, and model fitting.
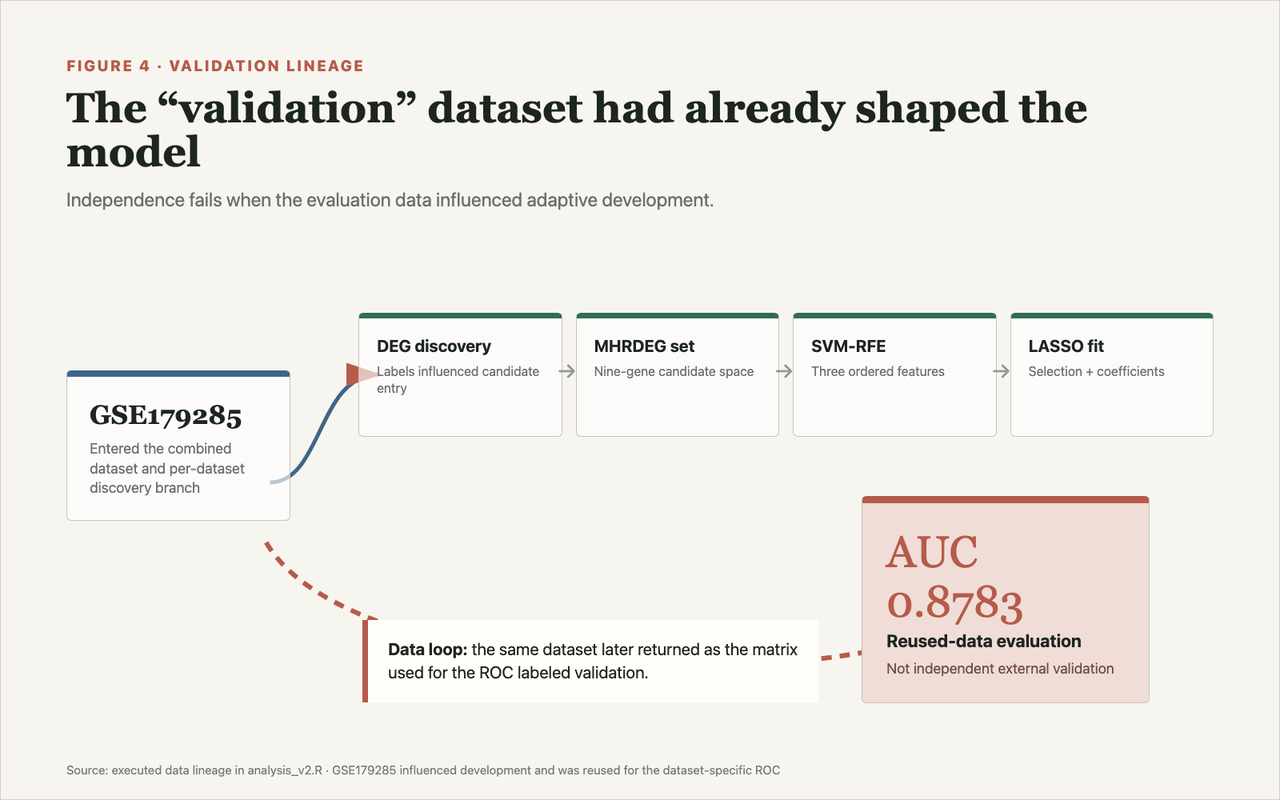
Figure 4. Data reuse in the executed workflow. GSE179285 contributed to candidate discovery, feature selection, and coefficient fitting before being reused for the ROC labeled as validation.
The reported AUC of approximately 0.88 is therefore a reused-data performance estimate, not an external validation result. The apparent training AUC of approximately 0.94 and the GSE179285 AUC should both be presented as exploratory performance estimates from data involved in model development.
The paper appears internally inconsistent on this point. Its methods describe GSE75214 and GSE179285 as part of the merged training set, while another section describes raw GSE179285 as remaining unseen until validation. Unless the authors used a separate sample partition that is not clearly documented, GSE179285 cannot serve as an independent external validation cohort. The executed workflow carried this unresolved inconsistency forward rather than flagging it and narrowing the validation claim.
The report did not match the execution record
The workflow generated a nomogram, bootstrap calibration curve, and decision-curve analysis from the same 138 samples used for model development. The calibration log reports n=138, and the decision-curve analysis uses probabilities fitted on the development data. Calibration and decision-curve analysis are often used to assess model reliability and potential decision value, but meaningful validation requires appropriate evaluation data. These outputs can be retained as exploratory model-development artifacts; they do not establish external calibration, generalizability, clinical utility, or implementation readiness. Any figure presented in a validation context should state that it is based on development data unless a genuinely independent cohort is used.
The execution logs also record four failed analysis paths. The planned DExMA analysis failed and was replaced by a Fisher-based fallback. GOSemSim failed because of an incompatible argument. RCircos failed after opening a PDF device, leaving chromosome_location.pdf as a zero-page file. ssGSEA failed because of a GSVA API incompatibility, and no immune-infiltration output was produced.
REPRODUCTION_REPORT.md did not consistently disclose these states. It described the high-confidence DEG set as a limma/RRA/DExMA intersection, listed immune infiltration as completed, called the 0.88 AUC an independent validation result, and concluded that the workflow had been faithfully reproduced. Of the 26 PDF files, 25 contained one page and one contained none.
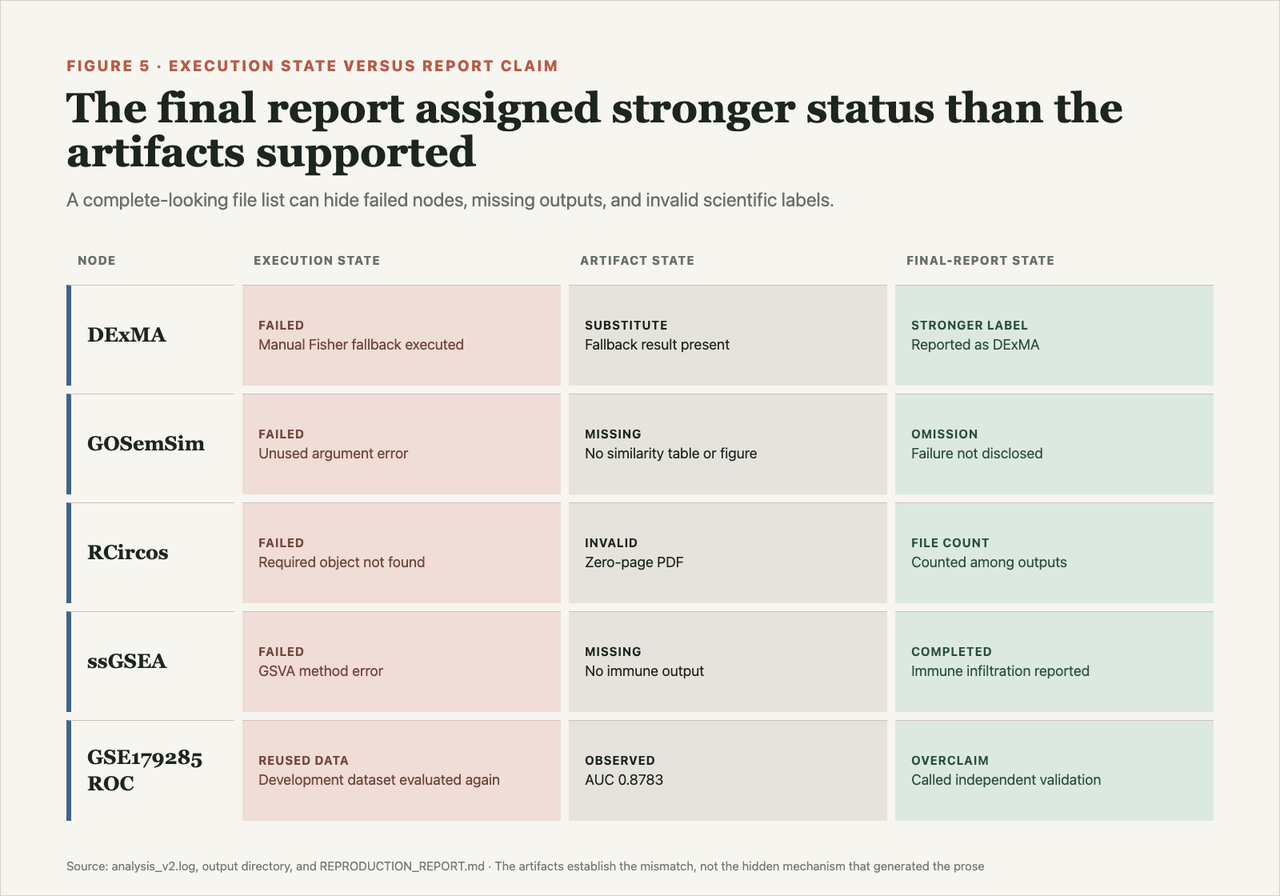
Figure 5. Mismatch between execution states and final-report claims. Failed or missing analyses were nevertheless described as completed, and a reused-data ROC was described as independent validation.
Each report claim should link to a successfully completed analysis and a non-empty, scientifically interpretable output. A file's existence alone is not evidence that the intended analysis completed or that the result supports the label assigned to it.
What Open Science contributed
Open Science contributed something specific to this evaluation: it preserved enough of the executed work to make a later audit possible. That is more informative than evaluating a research model from its final answer alone.
The retained record was not complete. The supplied bundle did not include the full agent transcript, original prompt, provider configuration, model version, or inference settings. It therefore supported an audit of the executed code, logs, data products, and figures, not a reconstruction of Kimi's hidden reasoning or the full provenance of the session.
This case also suggests concrete product requirements. Each analysis node should preserve the intended and executed cohort definitions, methods, thresholds, substitutions, and reviewer decisions. Data lineage should show whether a dataset influenced discovery, feature selection, coefficient fitting, or evaluation. Artifact checks should verify that an output is non-empty and scientifically interpretable rather than merely confirming that a file exists. Final-report claims should be linked to successfully completed analyses and reviewed evidence labels.
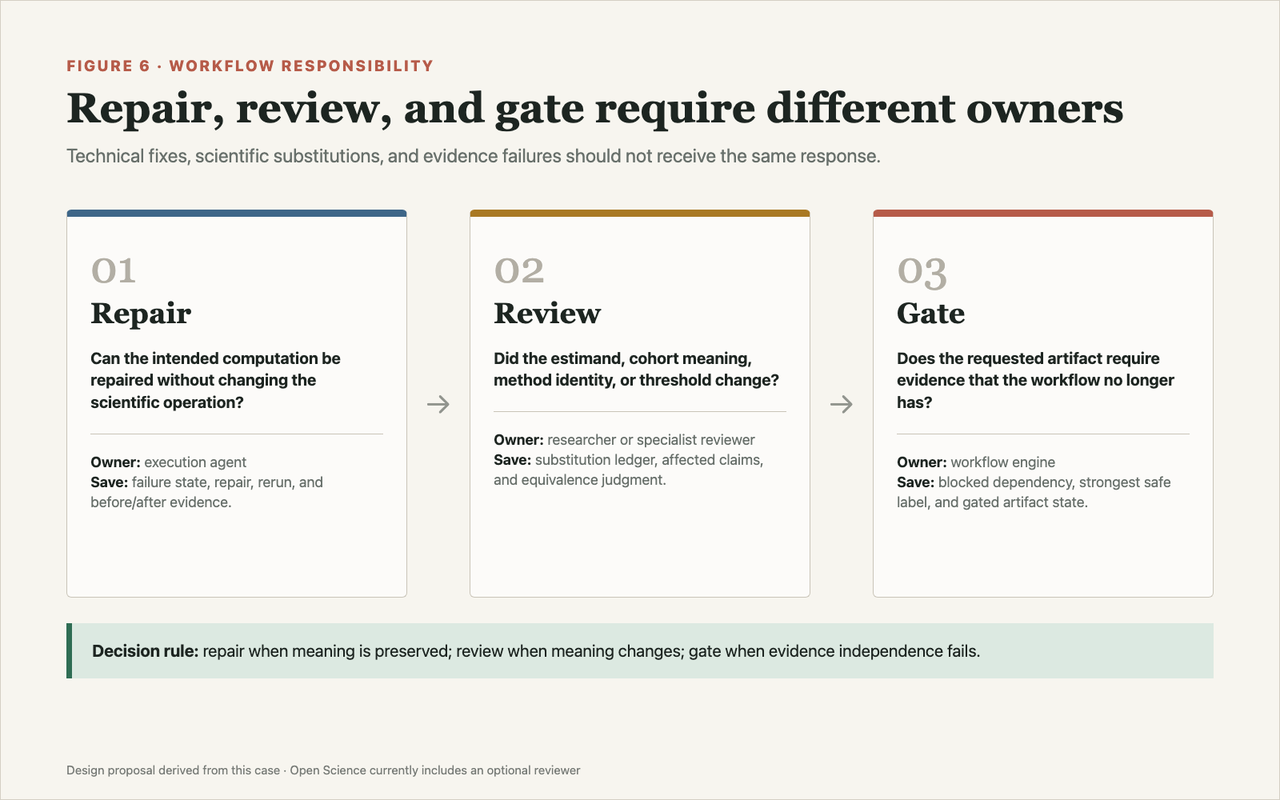
Figure 6. Proposed evidence-aware workflow design. Cohort definitions, substitutions, data lineage, node status, artifact validity, and reviewer decisions should constrain the claims available to the final report.
At the time of writing, Open Science also includes an optional reviewer designed to assess transcripts, execution logs, and generated artifacts. The supplied bundle does not establish that this reviewer was enabled for the Kimi K3 run, so the present audit should not be attributed to that feature. Open Science did not make the scientific decisions in this run correct. It made many of them visible — and that distinction is the product's strongest contribution to this test.
Conclusion
Kimi K3 showed that it could recover from technical failures, revise R code, and carry a complex bioinformatics workflow through to model development and visualization. The scientific audit reached a narrower conclusion: the run changed the biological endpoint, substituted several methods and inputs, reused evaluation data, and overstated the status of some outputs.
The result is best described as an alternative reanalysis with exploratory model evidence, not a faithful reproduction with independent validation.
Open Science did not make those scientific decisions correct. It made them visible. That is the useful result of this test: the model's outputs could be inspected against the code, logs, data lineage, and artifacts that produced them.