Prognostic Nomogram Construction AI Agent Workflow (2026)
Learn how the AIPOCH Nomogram Construction skill builds Cox-based prognostic nomograms from clinical CSV data, computes C-index, and renders Nomogram PDFs.
How Do Researchers Construct a Prognostic Nomogram for Survival Analysis?
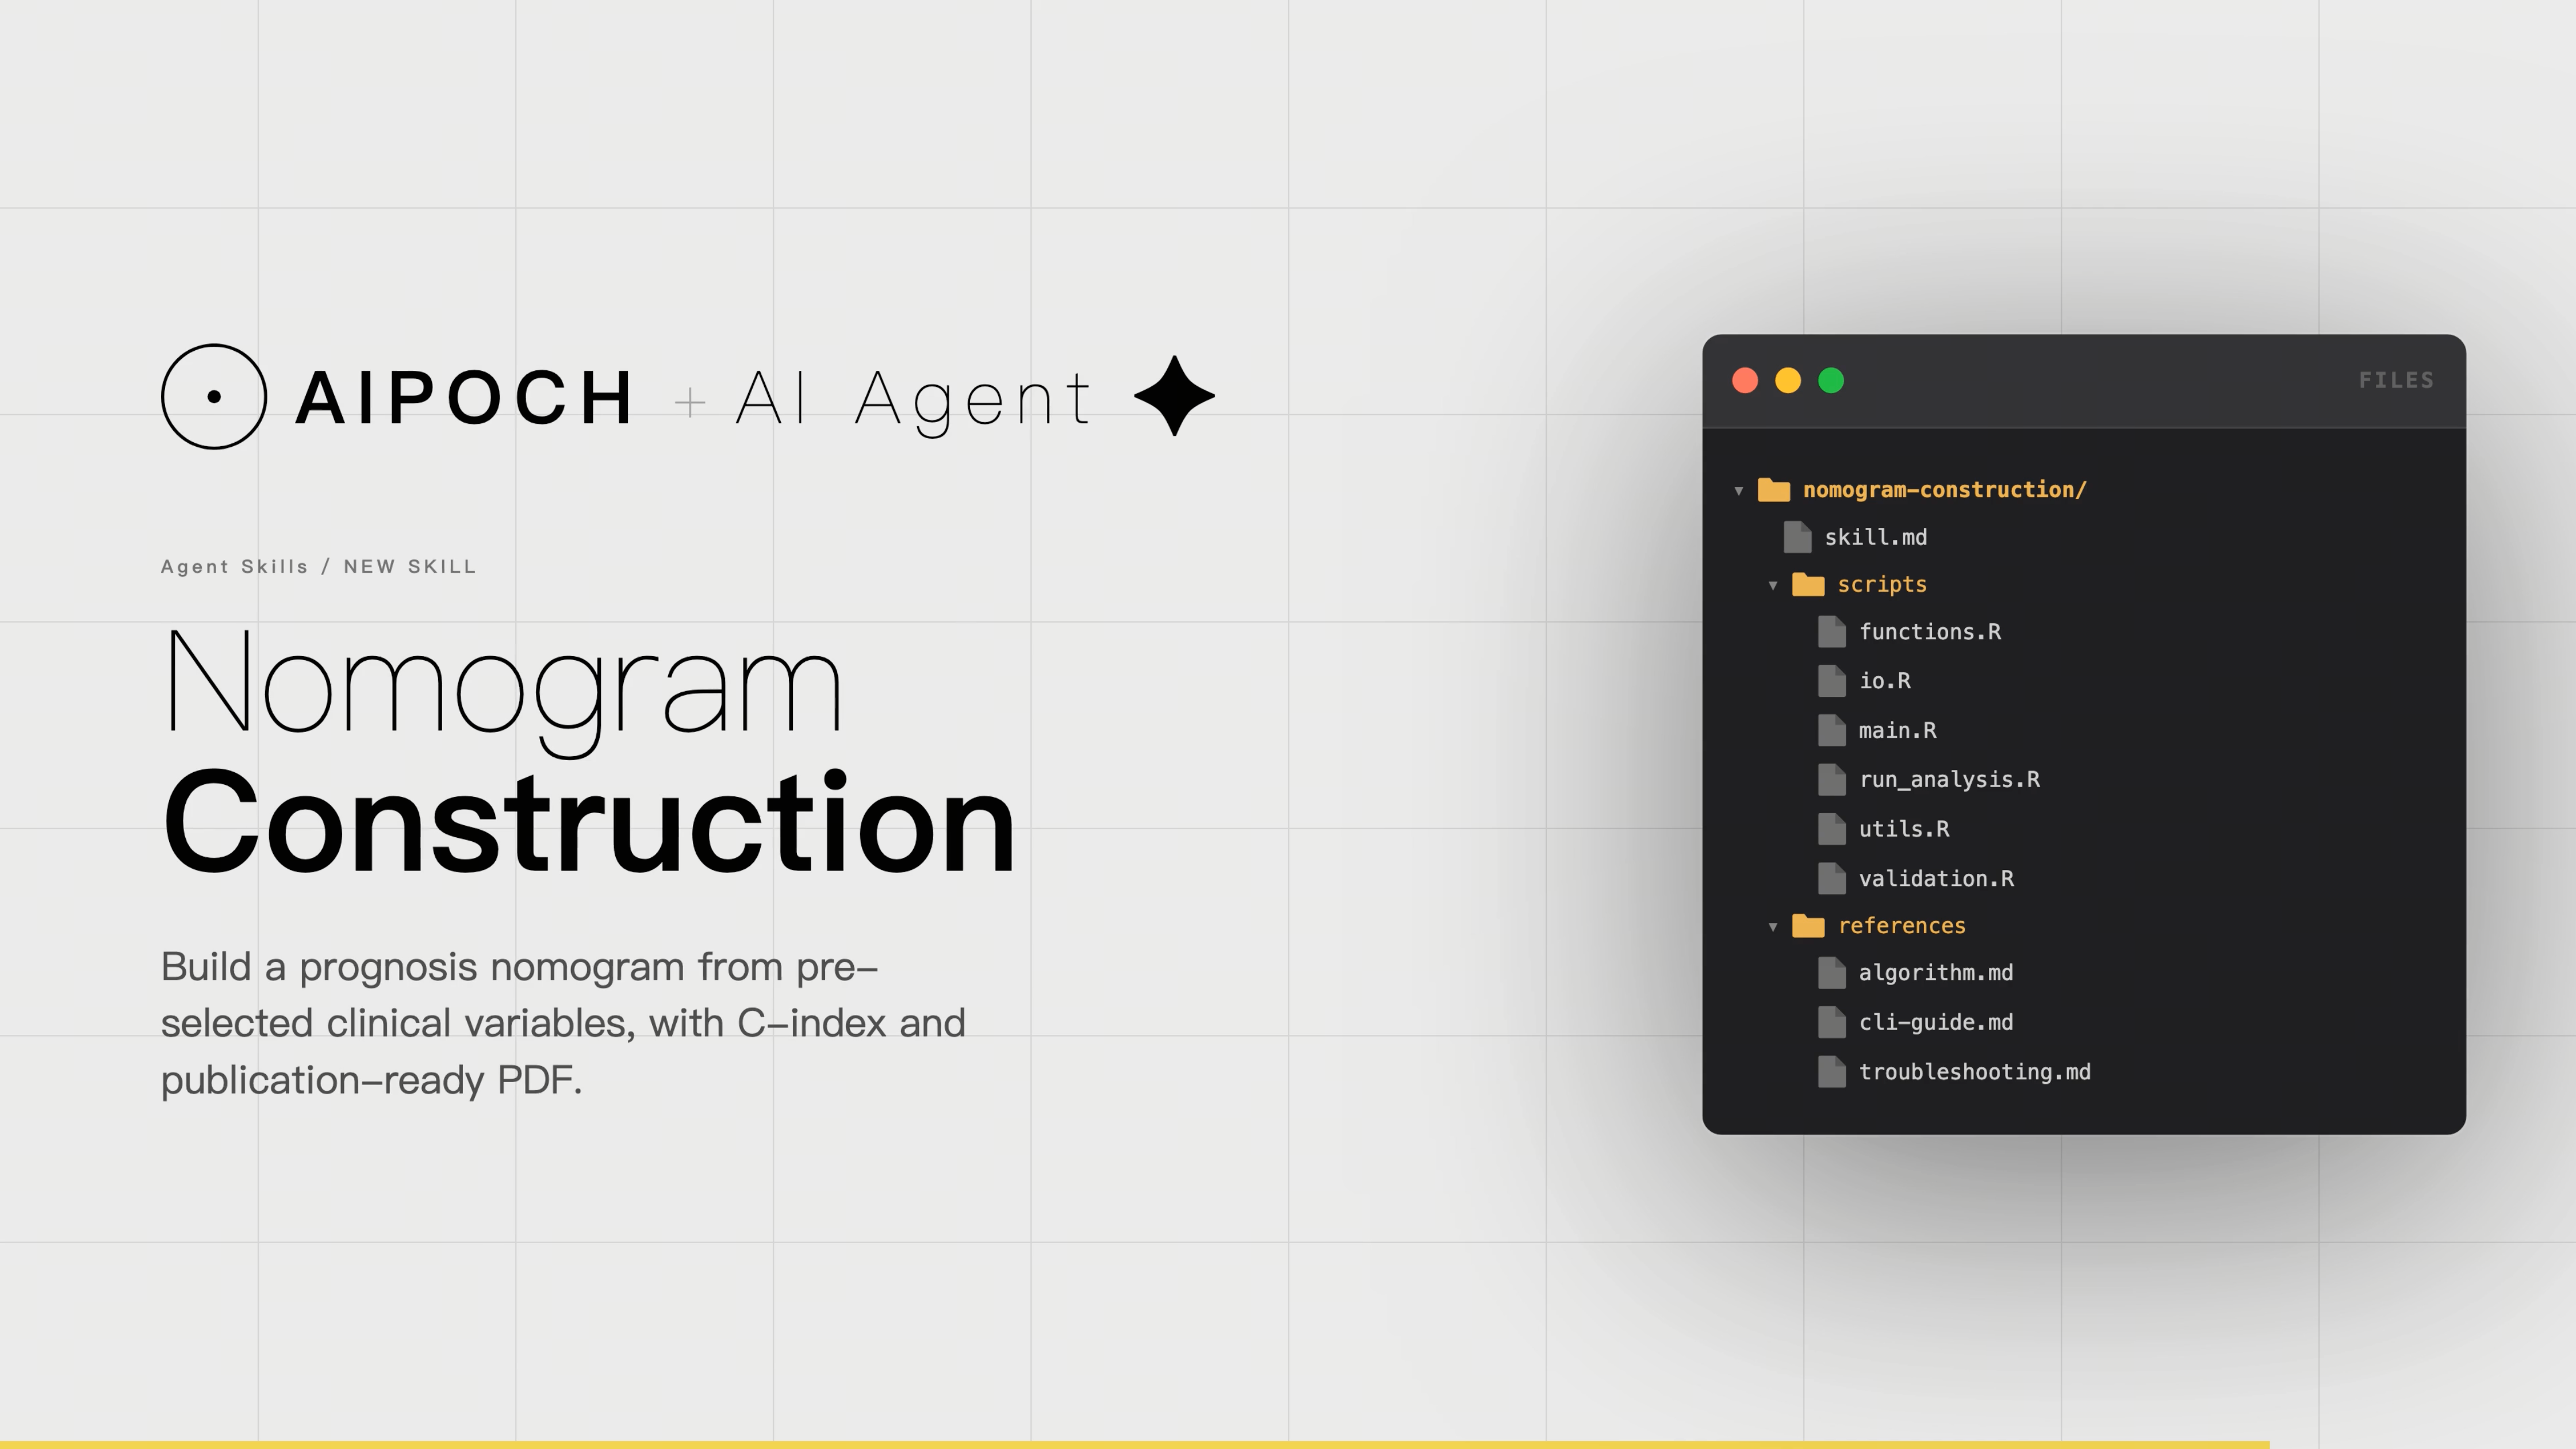
Prognostic nomogram construction is one of the most frequently repeated quantitative workflows in biomedical research — and one of the most technically demanding to execute consistently. The Nomogram Construction skill created by AIPOCH is designed to help researchers construct a prognostic nomogram from preselected survival-related clinical predictors, supporting the export of a model bundle, C-index summary table, and a PDF nomogram for individualized survival prediction.
Nomogram Construction skill source and reference modules are openly available on GitHub.
Why Does Nomogram Construction Matter for Survival Research?
Prognostic nomograms are a standard output in oncology and clinical epidemiology research because they reduce Cox regression models into a visual tool that assigns point scores to each predictor, sums them into a total, and maps that total onto individualized survival probability estimates. As Iasonos et al. (Journal of Clinical Oncology, 2008) described, nomograms are widely used in cancer prognosis primarily because of their ability to reduce statistical predictive models into a single numerical estimate of event probability.
Despite their conceptual simplicity, the manual workflow to produce a nomogram is operationally fragmented. Researchers must: clean and recode clinical variables, fit a Cox proportional hazards model using a survival-aware framework, define prediction time horizons, render the nomogram figure at publication-quality dimensions, and compute discrimination metrics such as the C-index — all reproducibly across revisions. The rms R package, which provides the cph and nomogram functions underlying most published nomogram workflows, requires careful parameterization that varies with dataset characteristics.
What Does the Nomogram Construction Agent Skill Do?
The AIPOCH Nomogram Construction skill is designed to help researchers construct a prognostic nomogram from already selected survival-related clinical predictors. It supports a Cox-based nomogram workflow that exports a serialized nomogram bundle, a C-index summary table, the complete-case modeling dataset, session information, and, optionally, a rendered PDF nomogram for individualized survival probability prediction at user-specified time horizons.
The skill is intentionally scoped to nomogram construction after predictor selection. It is not for univariate or multivariable Cox feature screening, calibration curves, ROC analysis, decision-curve analysis, diagnostic classification, non-survival outcomes, single-cell analysis, differential-expression analysis, or pathway analysis.
What Does the Nomogram Construction Agent Skill Accept?
- A clinical CSV file with sample IDs stored as row names
- A survival time column containing finite numeric values greater than 0
- A binary event indicator column encoded as 1 for event and 0 for censored
- At least three preselected prognostic predictor columns
- User-specified prediction horizons, such as 1, 2, and 3 years or 1, 3, and 5 years
- Requests to build a Cox-based prognostic nomogram and compute the C-index
- Requests to re-render a nomogram PDF from an existing .qs nomogram bundle in plot mode
What Outputs Does the Nomogram Construction Agent Skill Generate?
Build mode:
- data/Nomogram_list.qs — Serialized nomogram bundle containing the fitted model, nomogram object, C-index, modeling data, selected features, and prediction time points
- data/analysis_data.rds — Complete-case dataset used for modeling
- table/nomogram_c_index.xlsx — Nomogram discrimination summary table
- session_info.txt — Session information and build parameters
Plot mode:
- plot/nomogram_plot.pdf — Rendered nomogram PDF
- plot/session_info.txt — Plotting session information and parameters
How Does the Workflow Execute in Practice?
The following walkthrough uses a TCGA clinical dataset with 338 samples and describes how the Nomogram Construction skill processes the inputs and produces structured outputs for researcher review.
Note: the Slack interface and OpenClaw agent shown in the mockup are illustrative only, meant to demonstrate the interaction flow
Step 1 — Input: Clinical CSV and Natural Language Prompt
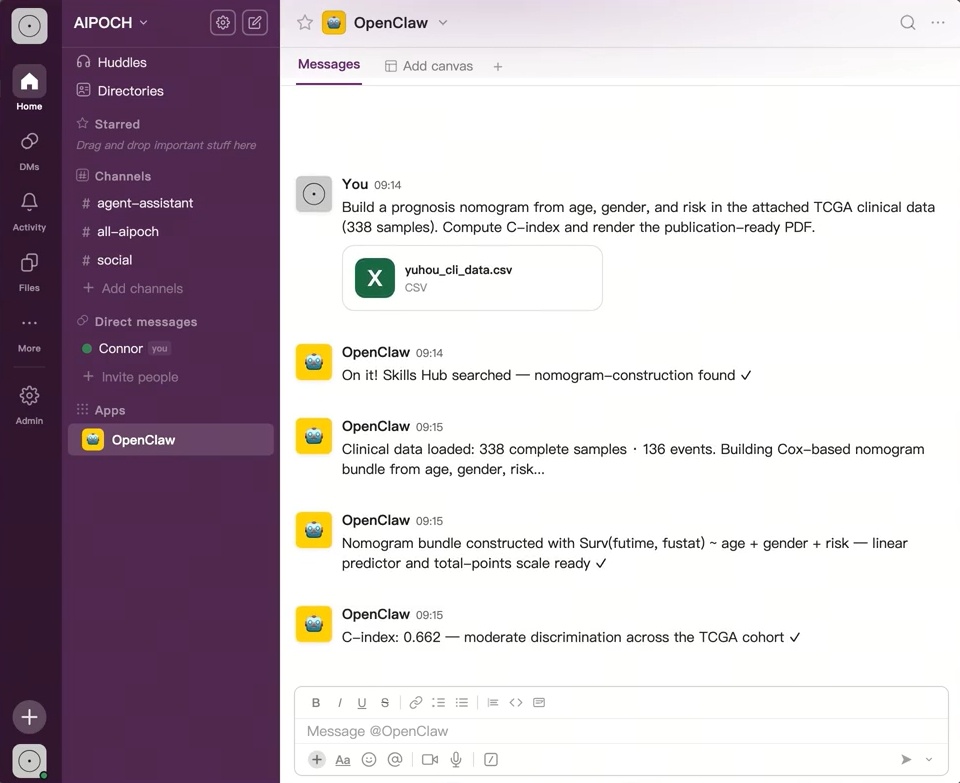
The researcher provides two inputs: a CSV file containing clinical data (in the demonstration, yuhou_cli_data.csv) and a natural language instruction that specifies the task:
"Build a prognosis nomogram from age, gender, and risk in the attached TCGA clinical data (338 samples). Compute C-index and render the publication-ready PDF."
This input format mirrors a real-world research request: the researcher has already completed predictor selection and is now ready to construct a Cox-based prognostic nomogram and generate the corresponding output files. The skill expects a clinical CSV file with sample IDs as row names, valid survival time and event columns, and at least three preselected prognostic predictors. Once the file and parameters are provided, the agent-side workflow can run the R-based build and plot modes, so the researcher does not need to manually operate the underlying rms::cph and rms::nomogram commands during routine use.
Step 2 — AI Workflow Execution: From Clinical Data to Cox-Based Nomogram
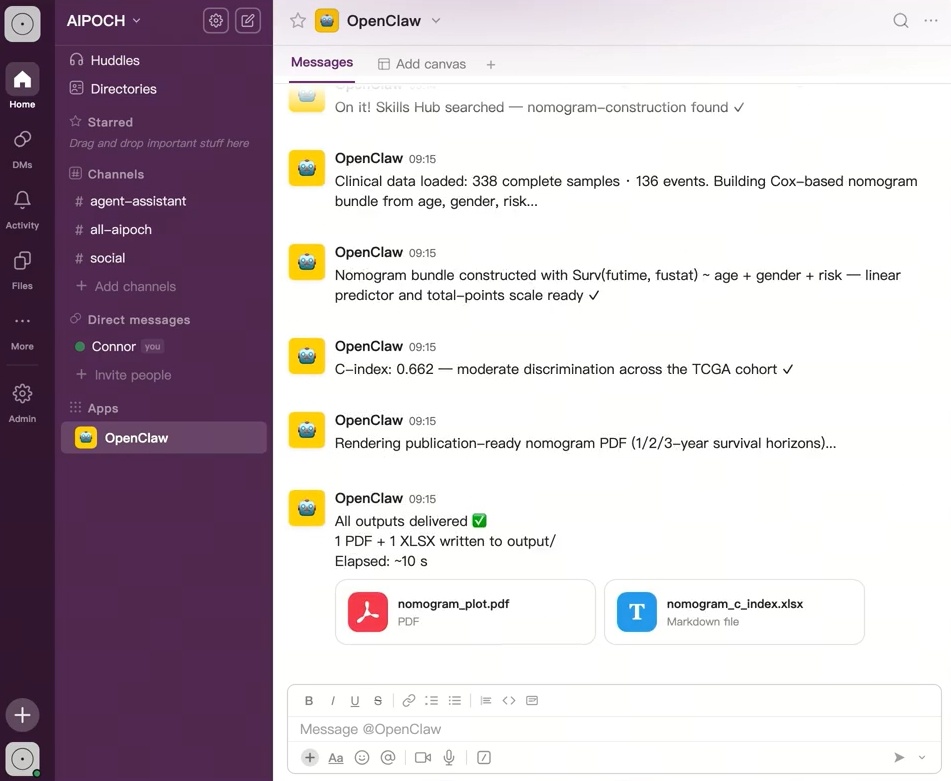
Step 3 — Structured Outputs: Nomogram PDF and C-Index Table
The agent delivers two primary outputs for researcher review:
Nomogram PDF. The rendered PDF nomogram visualizes the fitted Cox-based nomogram using the predictors supplied by the researcher, such as age, gender, risk group, stage, treatment status, or other preselected survival-related variables. The figure typically includes a Points scale, predictor-specific axes, a Total Points axis, and survival probability scales at the requested prediction horizons, such as 1-Year Survival, 2-Year Survival, and 3-Year Survival. Depending on the fitted rms::nomogram object, the plot may also display a linear predictor axis.
Researchers read the nomogram by locating a sample’s value on each predictor axis, projecting to the Points scale, summing the assigned points, and mapping the Total Points value to the estimated survival probabilities at the bottom of the figure. The PDF rendering step is configurable, including plot width, plot height, font size, line width, and font family, making the output easier to adapt for manuscript figures or internal review.
C-Index XLSX. The discrimination summary table reports the C-index for the fitted survival model. The C-index summarizes how well the model ranks patients by predicted risk, with higher values indicating better concordance between predicted risk and observed survival ordering.
Both outputs should be treated as model-based research outputs for expert review rather than standalone clinical conclusions. The nomogram and C-index do not establish predictor importance, calibration accuracy, clinical utility, or external validity by themselves. Interpretation should consider data quality, proportional hazards assumptions, calibration assessment, validation strategy, and clinical context.
▶ Watch the demo: A full video walkthrough of this workflow is available below.
Who Can Benefit From This Skill
The Nomogram Construction skill is relevant to biomedical researchers who have completed predictor selection and need structured outputs for publication or review. Primary users include: oncology researchers working with TCGA or SEER-derived clinical datasets; systematic review teams producing standardized survival figures across cohorts; bioinformaticians integrating nomogram outputs into multi-step analysis pipelines; translational medicine research teams preparing manuscript figures; graduate students and early-career researchers conducting survival analysis without deep R expertise; and computational biology teams supporting multi-center survival studies.
Conclusion
The AIPOCH Nomogram Construction skill can help researchers construct a prognostic nomogram from preselected survival-related clinical predictors, supporting the export of a model bundle, C-index summary table, and a PDF nomogram for individualized survival prediction.
AIPOCH is a collection of Medical Research Agent Skills created to support AI-assisted biomedical research workflows across literature review, evidence organization, bioinformatics preprocessing, data analysis support, and research writing tasks. The full skill library is available at the AIPOCH Medical Research Skills GitHub repository and the AIPOCH Agent Skills Library.
FAQ
What inputs does the Nomogram Construction skill require?
This skill accepts:
- A clinical CSV file with survival time, event indicator, and pre-selected prognostic features
- Requests to build a Cox-based prognostic nomogram and compute the C-index
- Requests to re-render a nomogram PDF from an existing
.qsbundle (plot mode)
When to Use the Nomogram Construction Skill?
Use this skill when you need to:
- build a prognosis nomogram from already selected clinical prognostic variables;
- estimate model discrimination with a C-index table;
- export a nomogram bundle and generate a publication-ready nomogram PDF.
Does the skill perform Cox feature selection or only model fitting**?**
Nomogram construction is designed to build a prognosis nomogram from pre-selected survival predictors and export the nomogram bundle with C-index table. According to the AIPOCH skill documentation, univariate/multivariable Cox feature screening, calibration curves, ROC analysis, decision-curve analysis, and non-survival outcomes are explicitly outside its scope.
Disclaimer
This article is intended for informational purposes only and does not constitute medical advice, clinical guidance, diagnostic recommendations, treatment decisions, or validated scientific conclusions. Sample data, model parameters, and output values shown are illustrative and do not represent any real clinical cohort or validated research finding.
The Nomogram Construction agent skill does not replace researcher judgment, and researchers remain fully responsible for evaluating the accuracy, completeness, and appropriateness of any outputs generated. All outputs it produces — including the nomogram PDF, C-index summary table, and model bundle — require independent verification and expert interpretation before use in any research or clinical context.