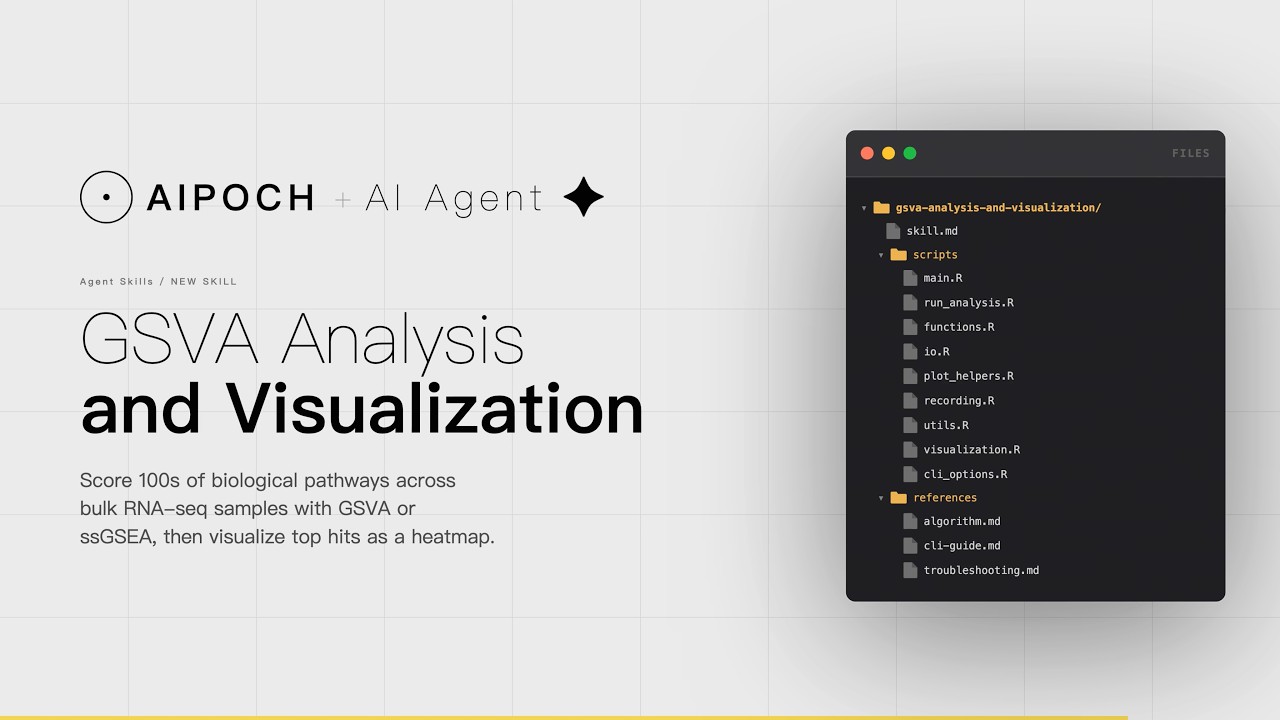
How Does GSVA Pathway Enrichment Analysis Work in a Bulk RNA-Seq Research Workflow?
Learn how AIPOCH's GSVA Analysis And Visualization skill runs KEGG/MSigDB pathway scoring, limma differential analysis, and heatmap generation from bulk RNA-seq data.
Running GSVA Pathway Scoring From Expression Matrix to Heatmap PDF With the AIPOCH Agent Skill
Pathway activity scoring is one of the most repeated, yet operationally fragmented, tasks in bulk transcriptomics research. The GSVA Analysis And Visualization agent skill from AIPOCH is designed to assist researchers in running a complete GSVA or ssGSEA pathway scoring workflow — from a prepared bulk expression matrix and sample group file, through limma-based differential pathway analysis, to a reusable result object and a heatmap PDF.
The skill is open-source and available in the AIPOCH medical research skills repository on GitHub.
Why Does Bulk RNA-Seq Pathway Analysis Remain a Workflow Bottleneck?
Pathway activity scoring addresses a well-recognized challenge in transcriptomics: individual gene-level findings are noisy, high-dimensional, and difficult to interpret without biological context. According to Hänzelmann, Castelo, and Guinney (BMC Bioinformatics, 2013), Gene Set Variation Analysis (GSVA) was developed to estimate variation in pathway activity across a sample population in an unsupervised manner, transforming gene expression profiles into pathway-level scores that serve as a starting point for downstream pathway-centric analysis.
Despite methodological advances, reproducibility remains a documented concern in bulk RNA-seq research. A 2025 study published in *PLOS Computational Biology (Degen & Medo)*, which analyzed 18,000 subsampled RNA-seq experiments across 18 datasets, found that small cohort sizes tend to produce enrichment analysis results that are difficult to replicate. Separately, a 2025 review in Quantitative Biology (Tzec-Interián et al.) noted that batch effects and experimental design consistency are key considerations for generating reliable bulk RNA-seq data. These findings point to an ongoing need for structured, parameter-documented pathway analysis workflows rather than ad hoc scripting.
The AIPOCH GSVA Analysis And Visualization skill is designed to support this need by providing a structured workflow for GSVA or ssGSEA pathway scoring, differential pathway comparison, and heatmap generation as a starting point for researcher review.
What Does the GSVA Analysis And Visualization Agent Skill Do?
The GSVA Analysis And Visualization skill can assist researchers in performing pathway-level enrichment analysis on grouped bulk expression data, producing a GSVA differential result table, the full pathway score matrix, a top-pathway matrix, a reusable GSVA_list.rda object, and a heatmap file for downstream interpretation, visualization reuse, and reproducible workflow execution.
Inputs the skill accepts:
- A bulk expression matrix (CSV or TSV; genes as rows, samples as columns; values must be numeric and contain no missing values)
- A sample group file (CSV or TSV with one sample column and one group column;sample names must match the expression matrix columns)
- A valid case/control comparison for pathway-level GSVA or ssGSEA analysis
- Optional heatmap customization parameters for visualization of a saved
GSVA_list.rda
Outputs the skill produces for researcher review:
The skill is explicitly out of scope for gene-level differential expression, single-cell analysis, methylation analysis, and clinical diagnosis.
How Does the GSVA Workflow Execute Step by Step?
The following walkthrough describes how the GSVA Analysis And Visualization skill can support a researcher through the full pathway enrichment workflow. The screenshots below are illustrative and represent example workflow behavior; they do not depict a validated clinical or production research run.
Step 1 — Input: Expression Matrix and Group File
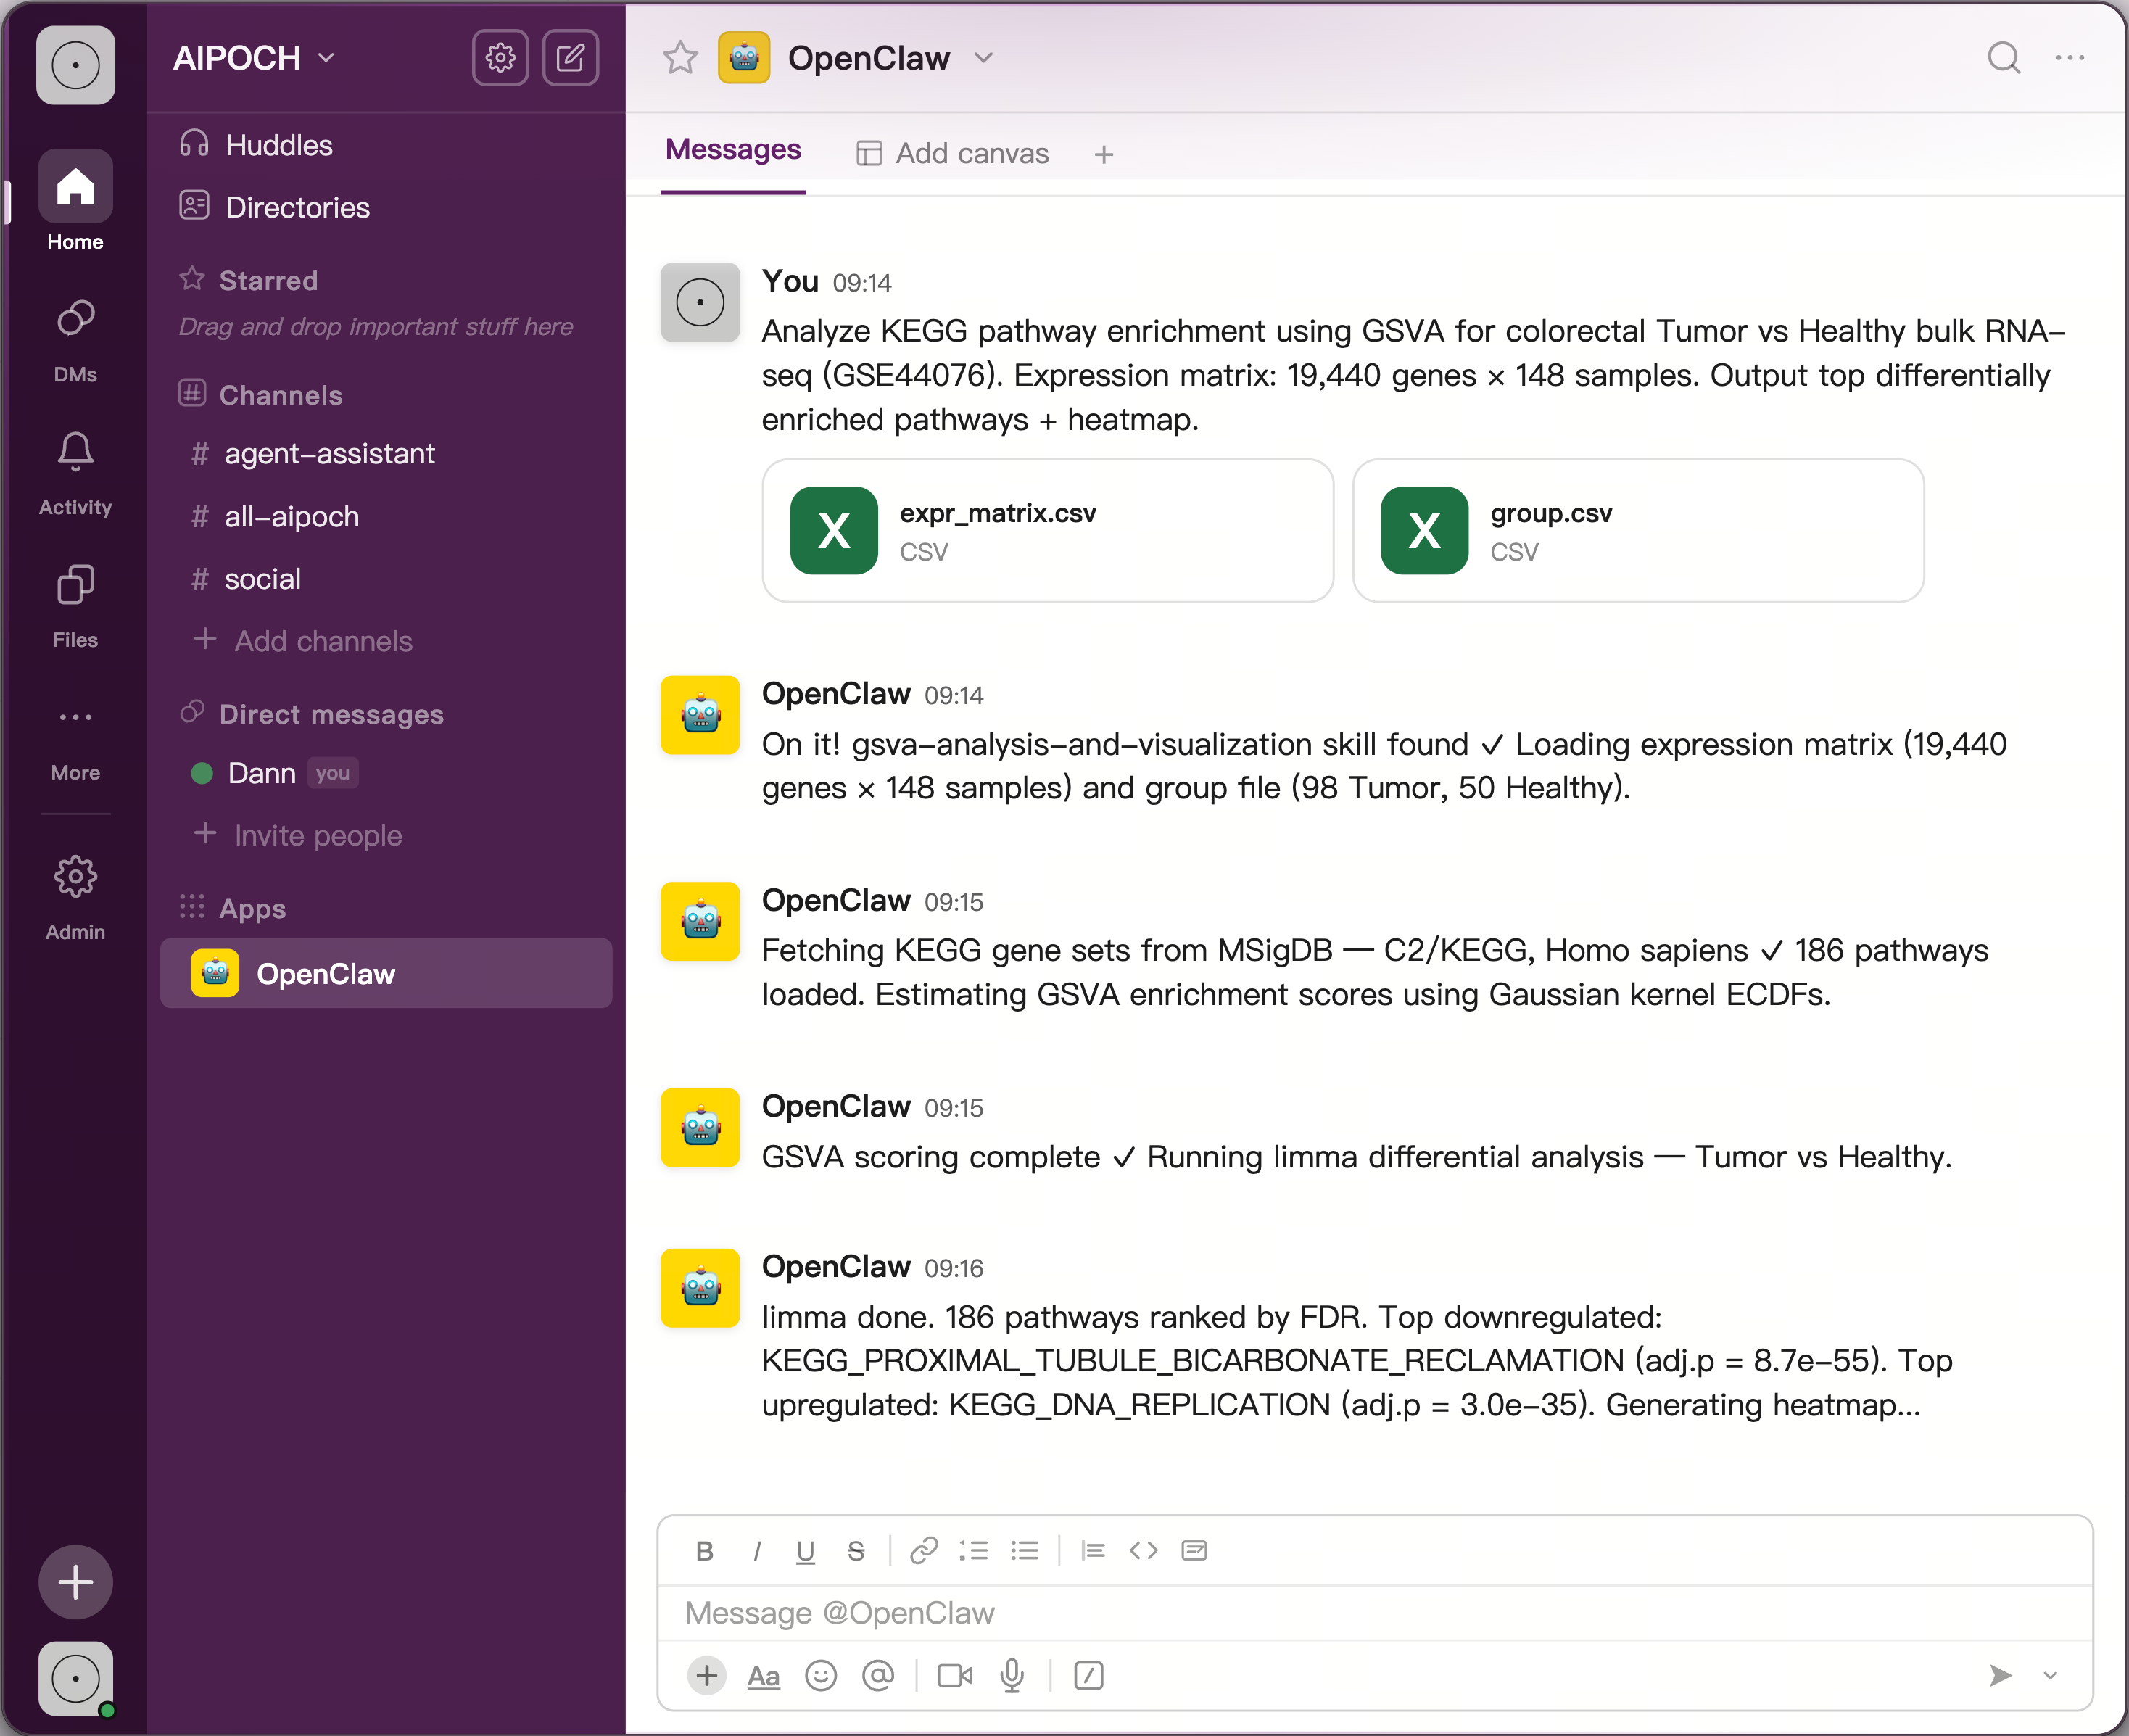
Figure 1 (Illustrative): AI agent workflow showing GSVA scoring and limma differential analysis execution steps.
Researcher inputs: Compare KEGG pathway enrichment scores between colorectal Tumor and Healthy bulk RNA-seq samples using GSVA, then generate a heatmap of the top differentially enriched pathways.
Input files:
- input/expr_matrix.csv — Gene-level expression matrix, 19,440 genes × 148 samples, derived from GEO series GSE44076 (Affymetrix probe IDs collapsed to gene symbols). File is large (19,441 rows); it is in the input/ folder.
- input/group.csv — Sample group assignments, 148 rows (98 Tumor, 50 Healthy).
Step 2 — AI Workflow Execution: GSVA Scoring and Limma Differential Analysis
Once inputs are validated, the skill proceeds through the following stages for researcher review:
- Gene set loading: MSigDB gene sets for the requested species and collection are fetched via msigdbr. For the C2/KEGG human collection, this may load approximately 186 pathways, as illustrated in the screenshots below.
- GSVA/ssGSEA scoring: The skill scores each pathway across every sample using the GSVA Bioconductor package, producing a pathway × sample enrichment score matrix. In the test run, 186 KEGG pathways were scored across 148 samples. The
gsvaandssgseamethods are both supported via the--methodparameter. Researchers who want to apply ssGSEA specifically for immune cell infiltration scoring — rather than general pathway enrichment — may find the ssGSEA Immune Infiltration Analysis workflow a useful complement. For a broader overview of how GSVA and ssGSEA fit into immune pathway analysis workflows, see How AI Agents Run Immune Pathway Analysis. - limma differential analysis: The skill runs limma on the pathway score matrix to test for differential enrichment between the two groups. Each pathway receives a logFC, raw p-value, and Benjamini-Hochberg adjusted FDR value. Pathways passing the configured FDR threshold are retained in the top-N output table for downstream review.
Step 3 — Structured Outputs: Tables, Saved Object, and Heatmap PDF
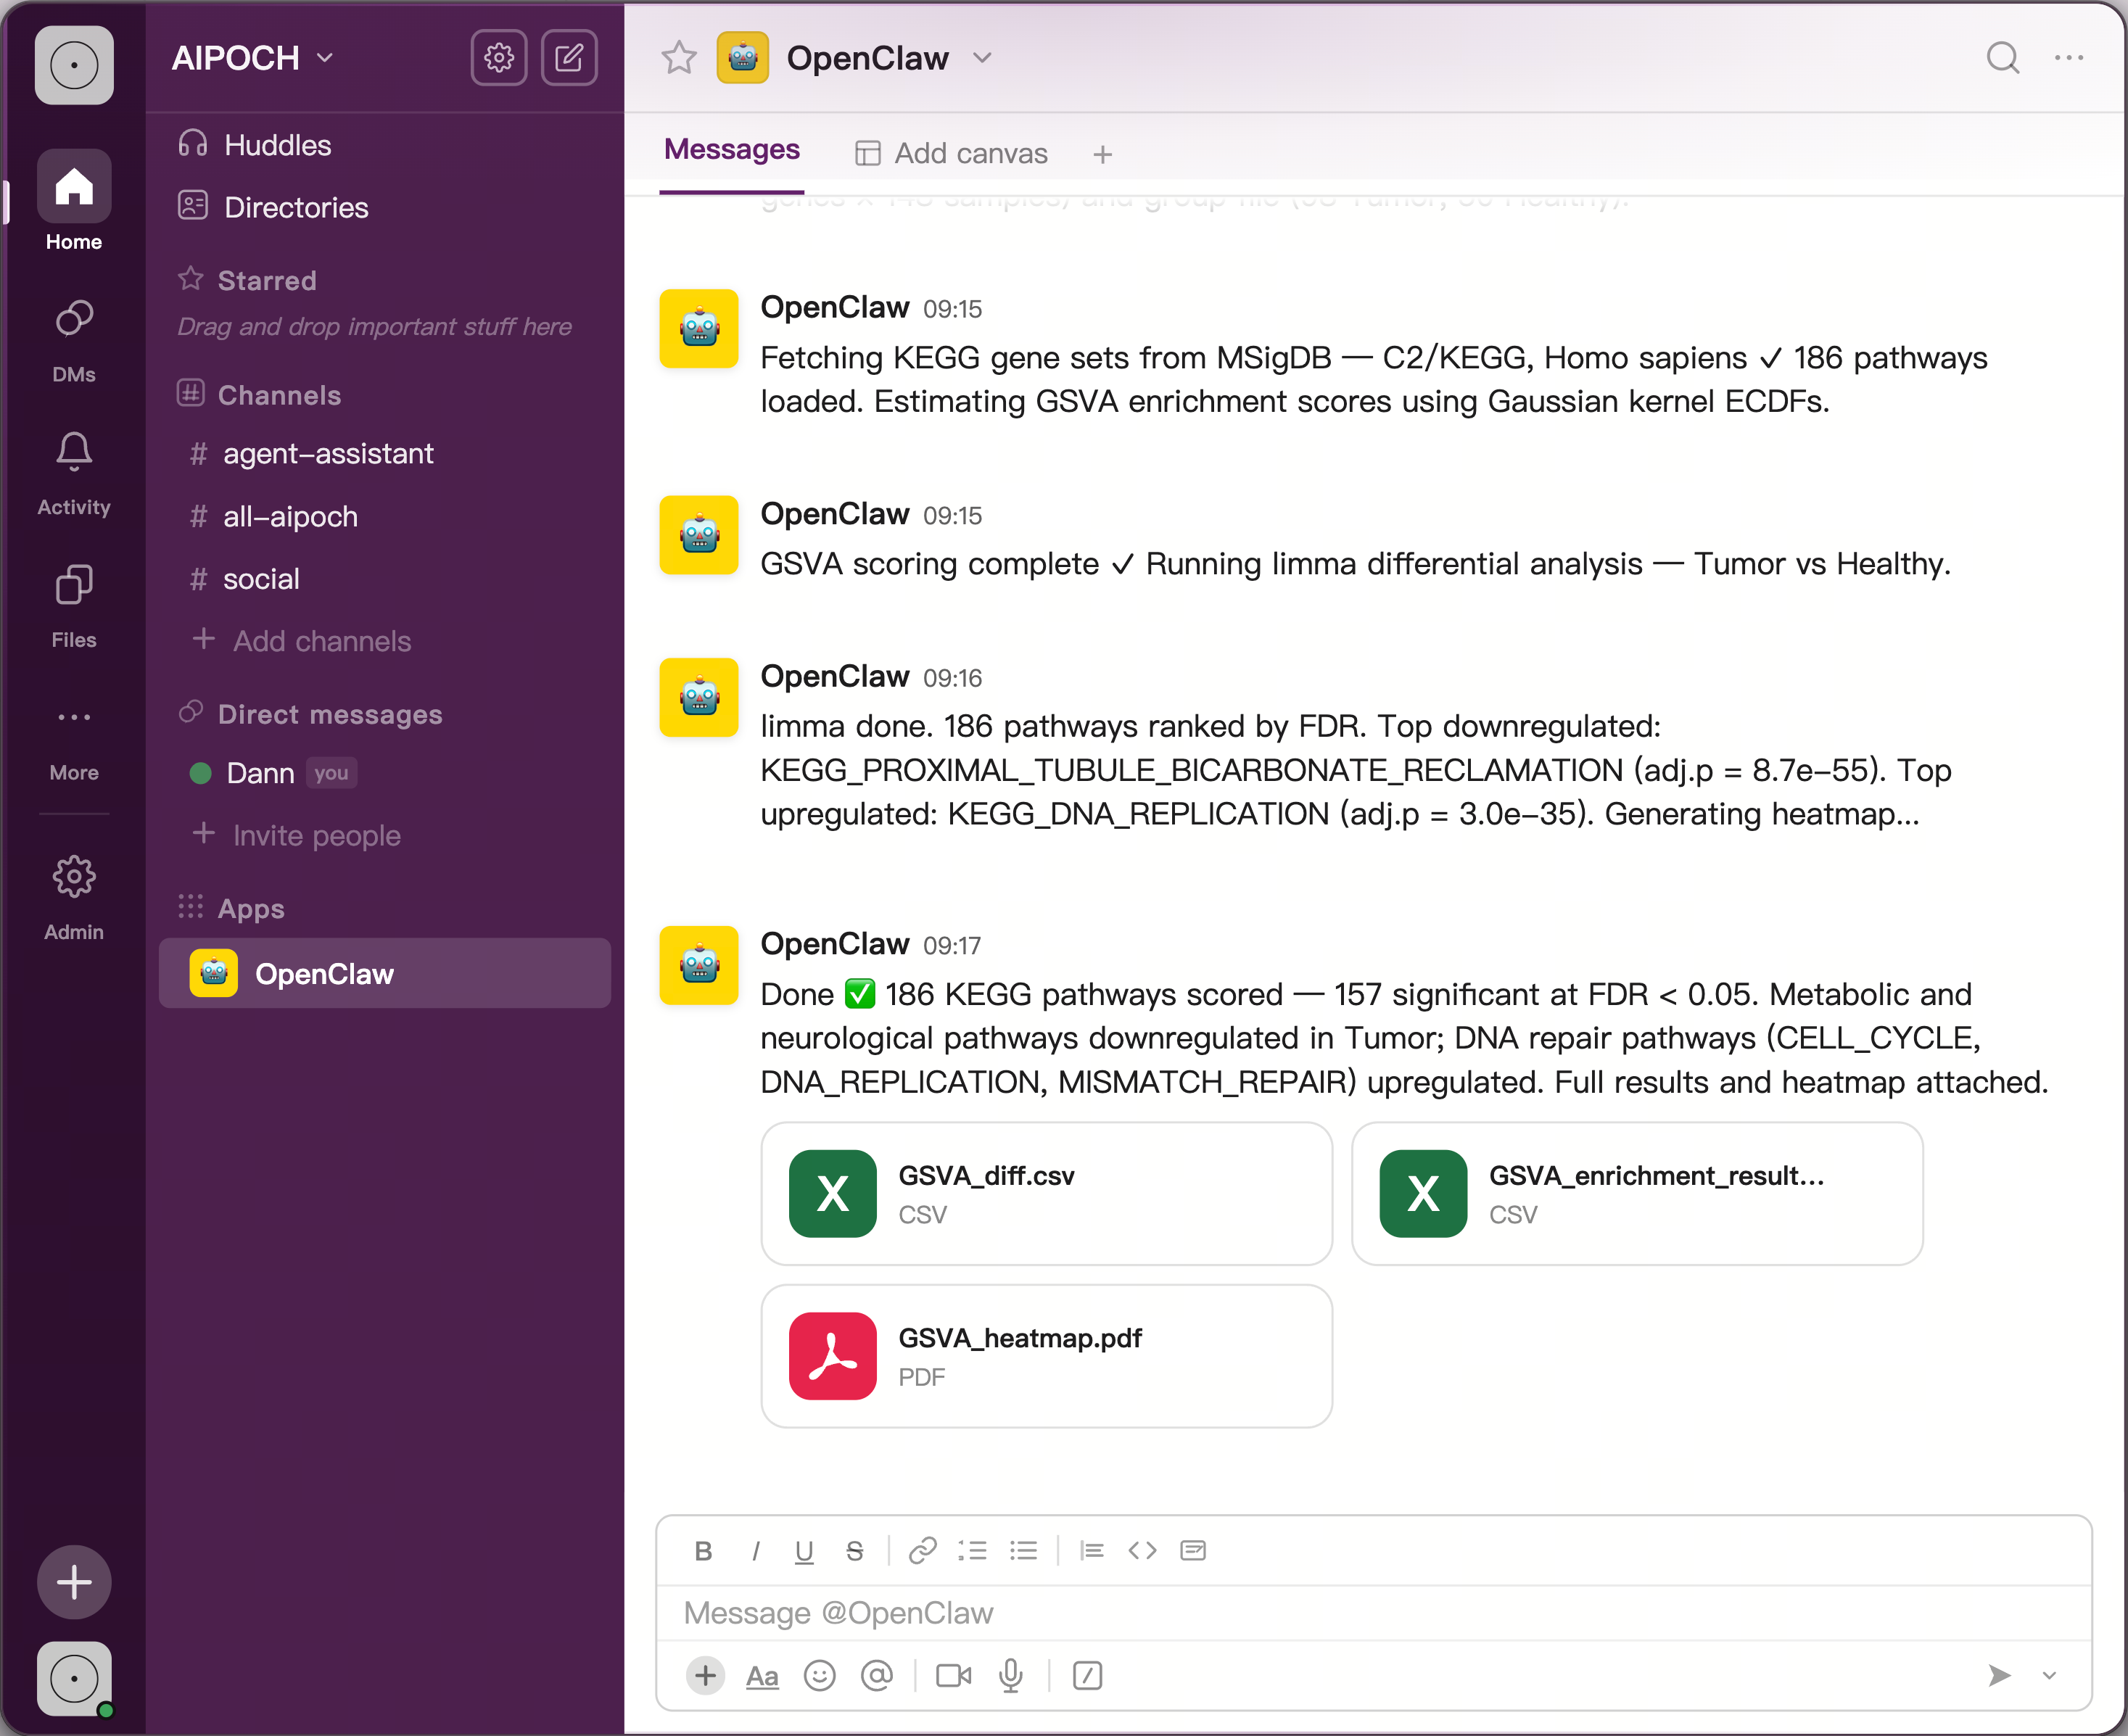
Figure 2 (Illustrative): AI agent workflow output summary showing attached result files.
Based on the test run, the skill produced the following outputs for researcher review:
GSVA_diff.csv— differential pathway results table with logFC, raw p-value, and Benjamini-Hochberg adjusted FDR for all scored pathways, ranked by FDRGSVA_enrichment_results_topN.csv— the top-N pathway score matrix (20 pathways × 148 samples in the test run), for downstream visualization and focused analysisGSVA_heatmap.pdf— a heatmap of top differentially enriched pathways across all samples
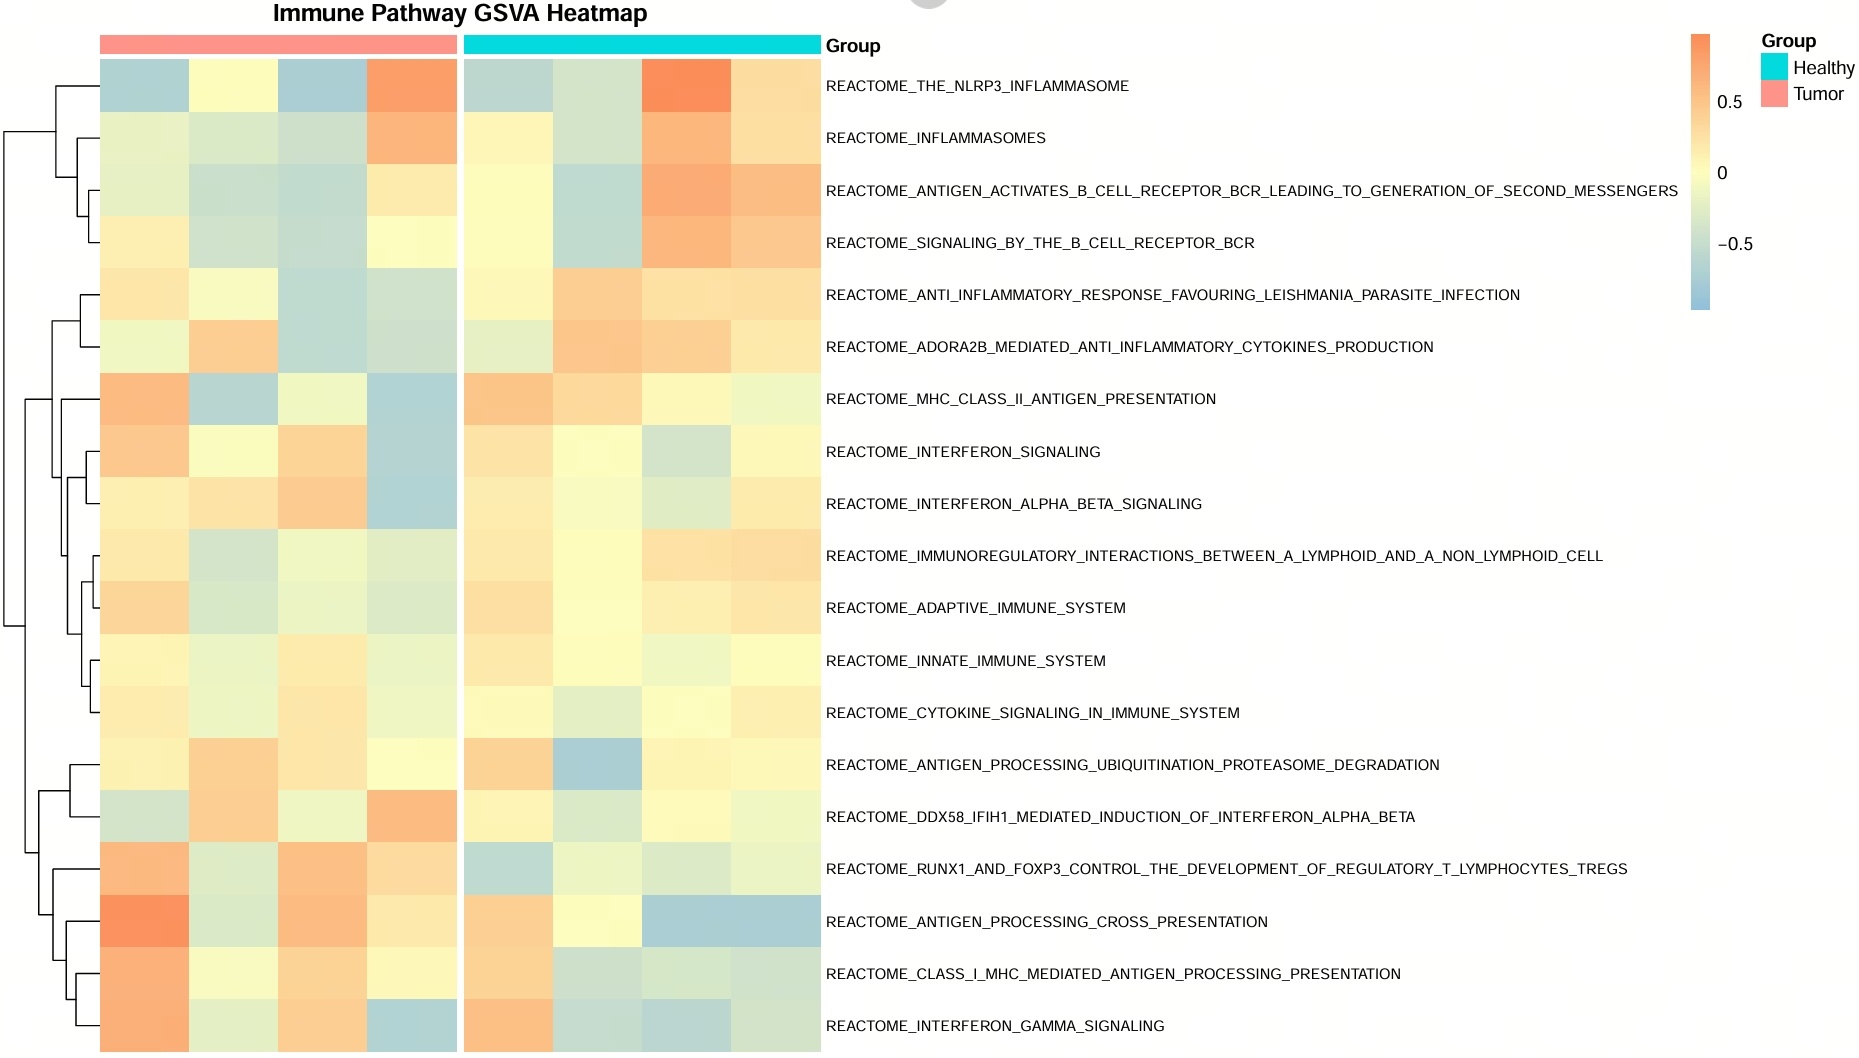
Figure 3: GSVA_heatmap.pdf output produced by the GSVA Analysis And Visualization skill. Rows represent selected top KEGG pathways scored by GSVA, and columns represent individual samples annotated by group, including Tumor and Healthy labels. The color scale reflects GSVA enrichment scores, with warmer tones indicating higher pathway enrichment scores and cooler tones indicating lower scores. Pathway ordering reflects hierarchical clustering applied to the selected top-pathway score matrix. This output was generated from a publicly available GEO expression dataset and is provided as a workflow output example; it does not constitute a clinical finding or validated research conclusion. All outputs require independent expert review before use.
For a complete walkthrough of the skill in action — from file upload through scoring, differential analysis, and heatmap generation — the demo video below shows an end-to-end run:
Who Can Benefit From This Skill?
The GSVA Analysis And Visualization skill is designed to support biomedical and computational researchers who work with bulk expression datasets. Potential beneficiaries include:
bioinformaticians running routine pathway enrichment analyses on case-control cohorts;
translational research teams organizing pathway-level evidence from GEO or in-house datasets;
graduate students learning structured GSVA and limma workflows;
computational biology teams establishing reproducible preprocessing pipelines; and
systematic review support teams organizing pathway evidence across multiple datasets.
The skill operates at the pathway level and is not intended for gene-level differential expression — researchers who need DEG analysis as a prior or parallel step may find the Differential Expression Analysis skill a relevant upstream companion.
The skill also requires bulk expression data and is not intended for single-cell, clinical, or diagnostic applications.
Conclusion
The GSVA Analysis And Visualization agent skill from AIPOCH can help researchers organize the operationally fragmented steps of bulk RNA-seq pathway enrichment analysis into a single, parameter-documented workflow. By providing structured outputs — including a differential pathway table, full score matrix, top-N subset, reusable .rda object, and heatmap PDF — the skill offers a reproducible starting point for pathway-level interpretation that researchers can independently verify and extend. All outputs require researcher review before use in any research or reporting context.
AIPOCH is a collection of Medical Research Agent Skills created to support AI-assisted biomedical research workflows across literature review, evidence organization, bioinformatics preprocessing, data analysis support, and research writing tasks. To learn more about how AIPOCH organizes its skill categories and the philosophy behind human–AI collaboration in research, see Introducing AIPOCH: A Library of Medical Research Agent Skills. For an overview of other highly ranked skills across the library — including data analysis, bioinformatics, and academic writing — see Top 10 AIPOCH Agent Skills for Medical Research. The full skill library is available at AIPOCH Agent Skills, and all skills are open-source via the AIPOCH medical research skills repository on GitHub.
Disclaimer
This article describes the GSVA Analysis And Visualization agent skill available through AIPOCH for research workflow support purposes only.
This article is intended for informational purposes only and does not constitute medical advice, clinical guidance, diagnostic recommendations, treatment decisions, or validated scientific conclusions. Sample data, model parameters, and output values shown are illustrative and do not represent any real clinical cohort or validated research finding. References and external links in this article are provided for informational purposes. AIPOCH does not endorse and is not responsible for the content of third-party sources.
The agent skill does not replace researcher judgment, and researchers remain fully responsible for evaluating the accuracy, completeness, and appropriateness of any outputs generated. All outputs it produces require independent verification and expert interpretation before use in any research or clinical context.